Market flow in forex refers to how buy and sell orders move through the market, revealing real-time supply, demand, and liquidity. By reading it, traders can understand who is in control (buyers or sellers) and make decisions based on what the market is actually doing, not what a lagging indicator says it did.
01 / What Is Market FlowThe continuous stream of orders that moves price.
Market flow, also called order flow, is the continuous stream of buy and sell activity that causes price to move. Every tick on a forex chart is the result of orders entering and exiting the market. Market flow is the study of that activity in real time.
Most retail traders focus on what price has already done: moving averages, RSI, MACD. These tools look backwards. Market flow looks at what's happening right now, and why. It shows you where orders are entering, how strong the buying or selling pressure is, and where liquidity is building or being absorbed.
Price doesn't move randomly. It moves because orders are being filled. Market flow is how you read those orders before the move is obvious on a chart.
02 / Why Most Traders Ignore ItLagging indicators are comfortable, but they cost you.
Lagging indicators are comfortable. They give clear signals and feel objective. The problem is they react after price moves, which means by the time you act, the opportunity has already shifted.
- ✕ React after price has moved
- ✕ Confirm trends already underway
- ✕ Miss liquidity context entirely
- ✕ Trigger late entries and exits
- ✓ Shows real-time order activity
- ✓ Anticipates moves before they develop
- ✓ Reveals who is in control
- ✓ Identifies genuine vs. false momentum
This isn't about discarding every indicator. It's about understanding what drives price at a deeper level, and using that as your primary lens.
03 / How to Read Market FlowA step-by-step process built in layers.
Reading market flow is a skill built in layers. Start with the basics and add depth as your eye develops.
- Strong, clean directional moves indicate aggressive buying or selling
- Slow, choppy, overlapping candles signal indecision and balanced orders
- Sharp reversals with long wicks suggest absorption or liquidity grabs
- Strong: large decisive candles, minimal pullbacks, consistent higher highs or lower lows
- Weakening: smaller candles, prominent wicks, slower continuation, failed follow-through
- Previous session highs and lows, where stops cluster
- Key support and resistance levels, where pending orders wait
- Consolidation zones, where trapped positions sit on both sides
- Absorption: price pushes in one direction but stalls repeatedly, suggesting strong opposing orders absorbing the pressure
- Rejection: price moves quickly into a level and snaps back, revealing a sharp imbalance between buyers and sellers
04 / Absorption vs. RejectionThe key distinction at turning points.
These two concepts are worth understanding in depth, because they appear constantly at turning points and are easy to confuse in the moment.
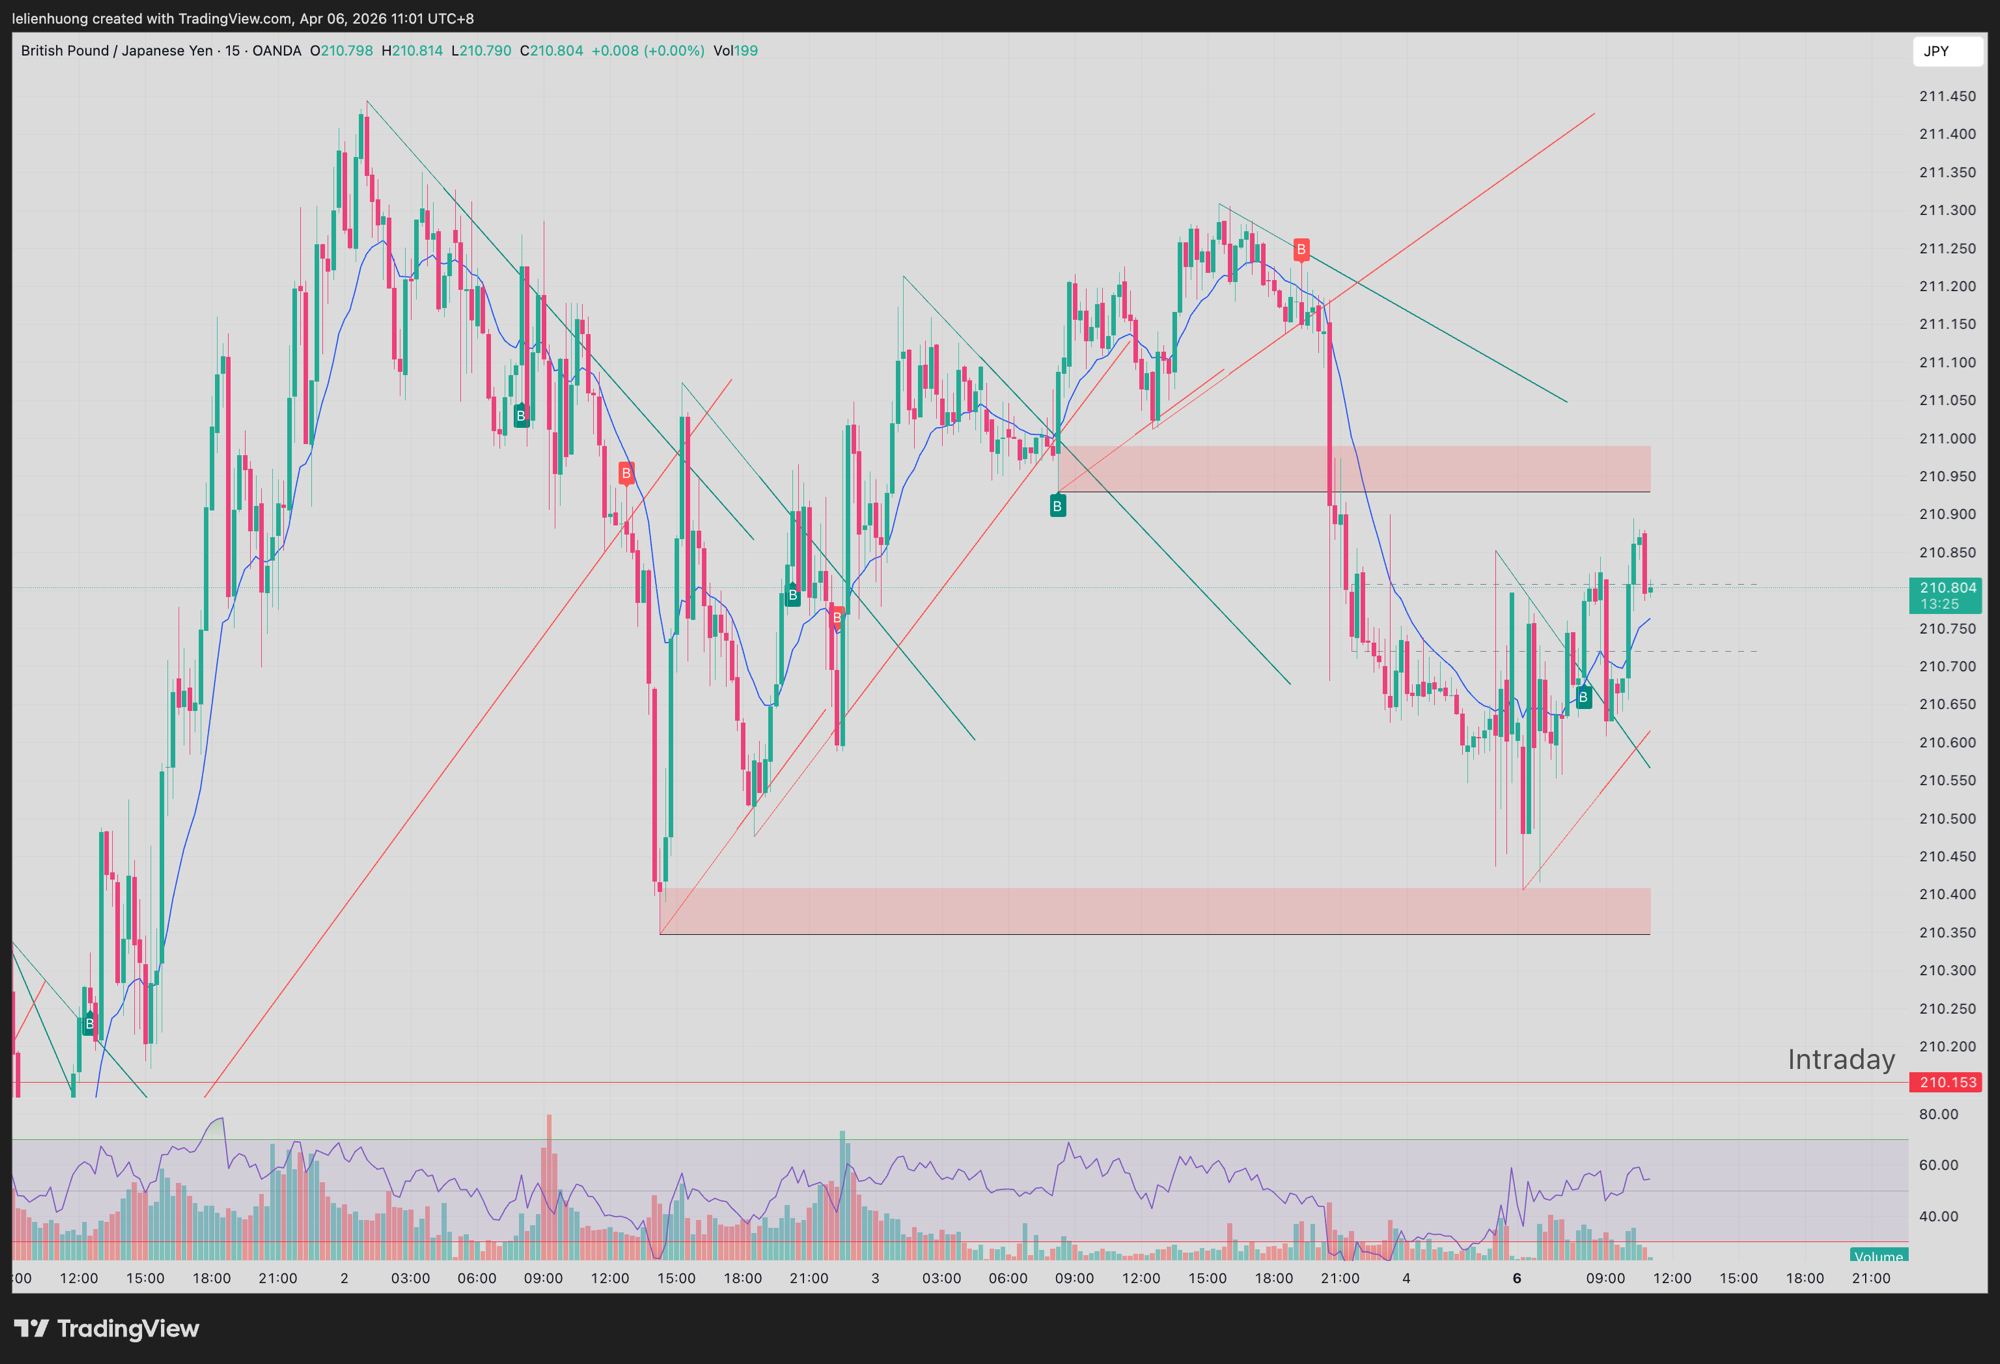
GBP/JPY 15-min. Red zones mark supply/demand areas where orders cluster. Price repeatedly tests these levels, showing absorption and rejection in real time.
05 / Understanding Liquidity ZonesNot all price levels are created equal.
Some levels attract far more orders than others, and those are the areas where market flow signals tend to be most significant.
06 / Why Most Traders StruggleThe gap between theory and live execution.
Reading market flow in real time is harder than it sounds. In theory, the concepts are straightforward. In practice, most traders face the same obstacles.
They're watching a 15-minute chart while missing the context on the higher timeframe. They're reacting to each candle individually rather than reading the developing story. They're emotionally attached to a direction, which distorts what they see. And they have no system for tracking whether their reads are improving over time.
The problem isn't that market flow is too complex. The problem is that most traders have no feedback loop. They make a read, it's wrong, and they don't know why, so the same mistake repeats.
07 / Beginner Habits That Build the SkillObservation, not shortcuts.
Market flow reading is developed through observation, not shortcuts. These habits accelerate the process.
Once you've identified a setup, size it correctly. Our free Position Size Calculator and Risk/Reward Calculator do the math instantly.
08 / SummaryA framework, not an indicator.
Market flow reading is not an indicator. It's a framework for understanding what price is actually doing and why. The concepts are learnable, but they take time to internalise.
- Market flow shows how buy and sell orders drive price, in real time, not after the fact
- Price behaviour, momentum, liquidity zones, absorption and rejection are the four core signals to read
- Liquidity zones are where the most significant market flow signals tend to occur
- The skill develops through deliberate observation and honest review of your reads over time
- Most traders struggle not because of complexity, but because they have no feedback loop to improve from
09 / Track Your ReadsNot just the result.
Understanding market flow is one layer of the skill. The other is understanding yourself as you apply it. Whether your reads were right or wrong matters less, early on, than understanding why you made them, and whether you were calm, rushed, anxious, or overconfident when you did.
That's the layer most traders never track. And it's often where the real edge is leaking.
Frequently Asked Questions
What is market flow in forex?
Market flow refers to the underlying buying and selling pressure that drives price movement. Rather than reacting to candlestick patterns on the surface, reading market flow means understanding the orders behind price — where liquidity sits, where large participants are active, and whether current moves are driven by genuine demand or thin liquidity.
How do you read order flow?
Order flow reading involves analysing volume at price levels, identifying liquidity zones where large orders cluster, recognising absorption (large orders absorbing selling pressure without price dropping), and spotting rejection (price testing a level and reversing sharply). These signals reveal what larger participants are doing beneath the chart.
Is order flow the same as price action?
No. Price action reads the chart — patterns, candles, and structure. Order flow reads what is driving the chart — the volume, liquidity, and participation behind each move. Price action tells you what happened; order flow helps explain why it happened and whether the move is likely to continue.
Do I need special tools to read market flow?
Depth-of-market (DOM) tools and volume profile indicators help, but you can start by observing how price behaves at key levels — whether it absorbs, rejects, or breaks through with volume. Journaling your market flow reads alongside your trades helps you calibrate your skill over time.